

let’s start how to use chart pattern basically patterns refer to recognizable patterns formed by price movements on financial charts, particularly in technical analysis. These patterns help traders and analysts identify potential trends, reversals, and trading opportunities in the market. Here are some common types of chart patterns:
Let’s start with How to use chart pattern?
Continuation Patterns
Symmetrical Triangle
It is a continuation pattern. After the symmetrical triangle resolves, traders assume that the prevailing trend will continue. The price approaches the apex, but it is unknown whether a breakout will be upwards or downwards. In the meantime, traders try to estimate the breakout and anticipate a continuation of the trend. If the price breaks out, it moves substantially above the upper trendline or below the lower trendline. The height of the triangle is also used to compute the potential price target after the breakout.


Ascending Triangle
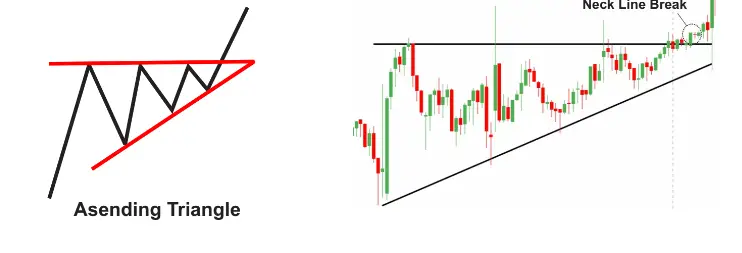
An Ascending Triangle is classified as a Bullish Continuation Pattern. This implies that the prior trend was an uptrend. The first trend line at the bottom is essential because it connects the Higher Lows, while the top horizontal line establishes resistance. The prevailing uptrend is expected to continue if the pattern is completed. The condition to complete the pattern is for the price to break out and close out of the horizontal resistance line. Professional traders place a Buy order anticipating a breakout from this level.
In the lower line at the bottom, a profit target can be measured by analyzing the price difference between the support and resistance levels of the triangle. The professional trader expects the price to rise above the resistance level and will often designate the target as his/her takes profit point.
Descending Triangle

Bearish continuation pattern; a triangle with a descending triangle as one of its sides. Traders expect a breakout at the lower horizontal support which is the opposite side of the triangle. A breakout, in this case, happens when the price changes and moves below the price below the horizontal support line. The other expected target can be calculated using the distance between the descending resistance and the horizontal support line. This is the distance from the breakout point projected downwards. The other possible breakout point in the ascending resistance of the triangle.
Reversal Patterns:
Head and Shoulders

When the Head and Shoulders pattern appears at the end of an uptrend, it is often seen as a bearish reversal pattern. The bearish reversal can be confirmed by a break below the neckline following the formation of the right shoulder. For this purpose, traders see target price levels typically equivalent to the length of the head to the neckline subtracted from the breakout point below the neckline.
Inverse Head and Shoulders

The inverse head and shoulders is one of the most major chart patterns in technical charts indicating the trend reversal from a bearish one to a bullish one. It is usually considered to be a bullish reversal pattern when it is formed at the end of a downtrend. It consists of three low price points called the head and two shoulders. To confirm the turnaround, traders should wait until after the formation of the right shoulder to look for a breaking above the neckline. More often, the target for the price to rise is determined by the measure of the height of the head and shoulders formation.
Double Top

A Double Top is a major chart pattern in technical analysis which most often indicates a reversal from an uptrend to a possible downtrend. It is considered a bearish reversal pattern most of the time. A second peak or the creation of a second top confirms the formation of this pattern. The pattern can be confirmed when there is a breakout below the low of the trough that appears between the troughs between the first and second peaks. The target price is calculated by subtracting the height between the shoulders and the peak point from the breakout point below the trough.
Double Bottom

A Double Bottom is a major chart pattern in financial markets that usually announces the reversal of the downtrend to an uptrend. The pattern is normally seen as a bullish reversal pattern. Should it occur on the market after the price has been descending for a long time, traders will further expect the upward turn. As we see in Figure 1, a Double Bottom consists of two almost equally low peaks with a clear descent between them. The neckline is drawn through the local peak between them; similarly, to the higher peaks, above which the head-and-shoulders pattern is drawn. After the second local trough is formed, traders wait for a breakout above the opposite peak to make sure that the scenario is a bullish reversal.
Price increase target. if any one ask me How to use Chart pattern? always the rule, the target price for the purchase is estimated by adding the amount equal to the distance from the neck to the peak to the breakout point above the neck. This will be the equivalent of the height of the pattern. A graph pattern might be established by constructing parallel levels around the trough and the neck. They form a congestion zone flanked by both peaks before the breakout occurs, hence the same expected target level.
Chart Pattern Analysis conclusion
In conclusion, chart patterns are formations that create visual shapes based on price movements in financial markets. They help traders and analysts to predict future price movements and build reliable strategies. Overall, chart patterns serve as visual instruments that assist in analysing market trends, identifying trading opportunities, applying an efficient risk management strategy, and making rational decisions based on price action and the structure of the market. Integrating chart patterns with other technical tools creates a well-based trading strategy in modern financial markets. Hope the motive of How to use Chart pattern? is full fill the requirement.